How does this report differ from what else is out there?
- This study integrates absolutely every data type available from the largest data release ever made in this region – meaning this study is more detailed and robust than any previous.
- The report reviews the literature and assesses the state of knowledge for the area and historic exploration activities. It also considers the weaknesses of each dataset and highlights conflicts between previous interpretations and the data.
- Use of proprietary software from the creators of the industry leading XField potential field interpretation package means the data has been synthesised using one of the most powerful techniques available.
- Our results are placed into the context of geological evolution of the region and exploration potential – The report makes important interpretations about the tectonic development of major trapping structures and the likely location of source kitchens in the area.
What questions does it help to answer?
- What is the sub-basalt structure of the Wyville-Thomson Ridge and how and when did it form – are there any pre-cretaceous basins? (Spoiler: It appears so!)
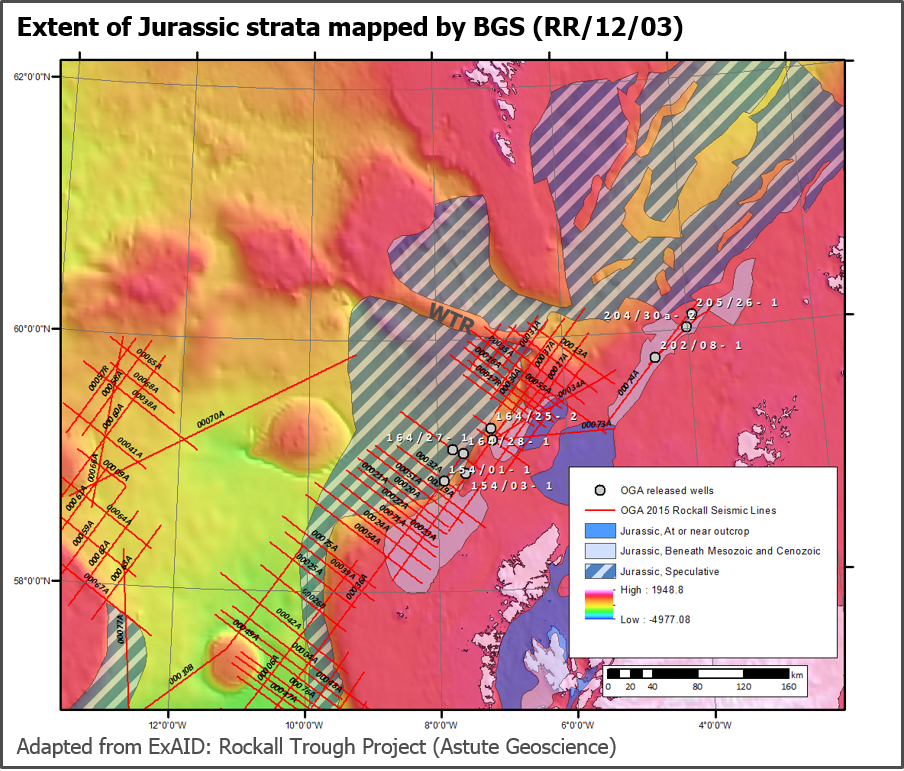
- Where might there be source rocks? We have a defensible model for the distribution of pre-Cretaceous (i.e. possible Jurassic and Permo-Triassic) rocks in the region.
- Why has exploration not worked in the past and how could it be done better? We redefine the extent of the basins in the area and have a 3D depth model (and sediment thickness maps). The report uses this information to assess the reasons behind past exploration failures
Deliverables:
- Fully tied network of at least 20 2D/2.5D density and velocity models (time and depth), satisfying well data, seismic data, potential field data and an assumption of Airy’s Isostasy
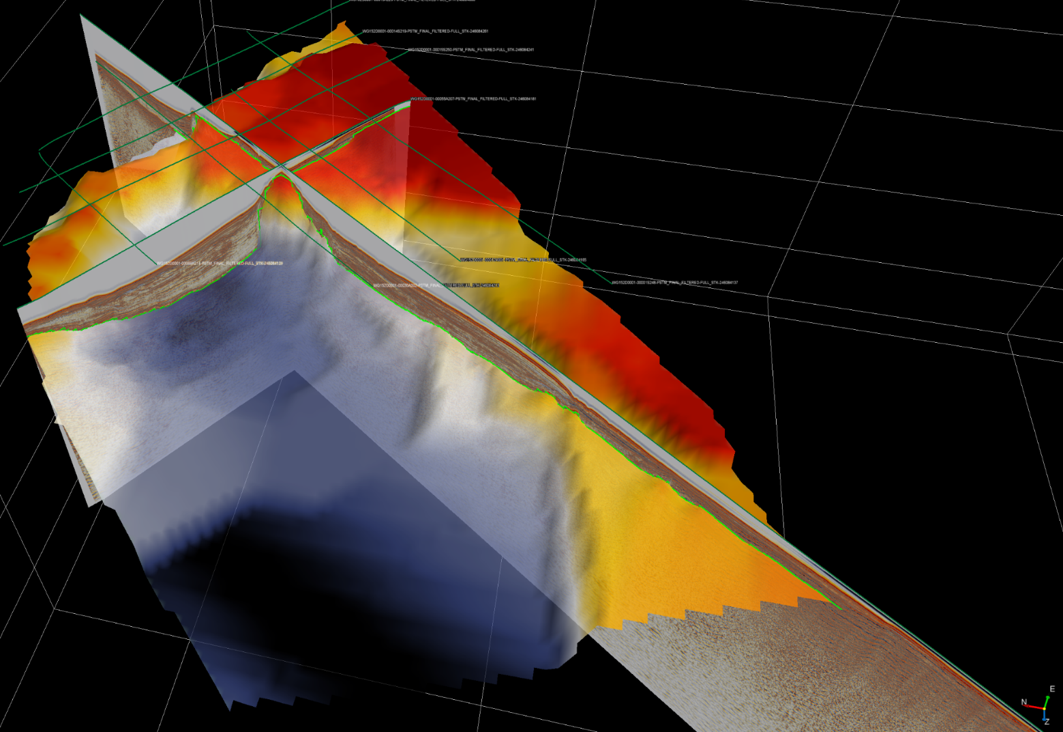
- Additional advanced seismic attributes calculated using proprietary tools
- Key 3D horizons derived from seismic and potential field modelling (time and depth)
- Sediment thickness map
- GIS-based map of structural elements shown on key potential field grids
- Detailed report containing:
- Comprehensive review of literature
Synthesis of geological and exploration information
Details about advanced data processing and interpretation methods
Results and implications for the geological evolution of the region
Discussion of the exploration potential
For more information please contact us or Stephen Rippington